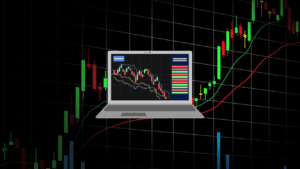
Candlestick patterns are crucial to understanding the stock market and trade. Identifying a pattern can be the difference between selling or not. Here are the main candlestick patterns to watch out. Check and understand the basic trader points of each Candlestick patterns and charts: Bullish, Bearish and Doji trends of the stock market.
What are Candlestick Patterns:
Before delving into specific patterns, it’s essential to understand candlesticks.
Candlesticks illustrate prices over a specific time on the stock market. On a daily chart, each candlestick represents one day, whereas on an hourly Candlestick Chart, each candlestick represents an hour. There are two types of full-bodied candles; bullish and bearish.
A bullish candle is usually white or green, meaning price action increases over time. A bearish candle, on the other hand, is usually black or red and indicates that price action decreased over the period to understand basic Candlestick charts.
In many ways, bullish and bearish candles are the opposite of one another because on a bullish candle, the opening price is at the base, and the closing price is at the top, while the opposite is for a bearish candle. Both types of candles have in common that the highest price is represented at the top of the wick and the lowest at the bottom.
The wick, also known as a tailor shadow, is a line that comes out of both ends of most candles and shows the highest and lowest prices of the candle’s period.
You may also come across a candle without a body. This is known as a Doji and means that the price did not change at all or significantly for the period’s opening and closing. A wick may still be present to mark times when the price rose and fell but did not last long enough to reach the end of the period on Bullish, Bearish and Doji stock market patterns & trends.
The candlestick patterns to watch out for:
The order and frequency of certain types of candles can suggest that a pattern is emerging, which can inform business decisions. Here are some of the most important ones: Check and understand the basic trader points of each Candlestick patterns and charts: Bullish, Bearish and Doji trends of the stock market.
Bullish Patterns:
The Supernova
The Supernova is precisely what the name suggests; an explosion of action. A supernova means a sharp increase in shares traded in exchange.
The rise and peak of a supernova mean an increase in opportunities to buy in, but traders can cash in on the inevitable decline as an opportunity to short-sell. Short selling means selling borrowed shares to retrieve them when the price drops.
Traders can then return the shares to the lender and keep the price difference. Supernovas are unpredictable, so proceed with caution if one occurs. Events such as news, world events, or even a viral post on social media can trigger a supernova.
The Stair Stepper Candlestick Patterns
A stair stepper is like a steadier, more stable supernova rather than the spontaneous sharp rise in price that characterizes supernovas. It’s not always a steady upwards trajectory, as there can be brief bearish periods of consolidation which some traders refer to as “sideways price action.” However, star steppers are overwhelmingly bullish.
The little periods of sideways price action on the way up give this pattern its name, as the chart resembles the steps of stairs. Although easier to foresee than a supernova, the steady upwards journey doesn’t always mean that they’re predictable, and they can turn just as fast as a supernova.
Bearish:
The Crow: Trader Candlestick Patterns
The Crow trend illustrates a steady decline in price action. This is a less-than-ideal pattern as the stocks and price drop consistently; think of it as price value is being away by picking crows. The term “Three Black Crows” is commonly used during this period as they are three bearish candles with lower closing prices than their predecessor.
This harmful pattern can be triggered by regular selling pressure. Sometimes the crow can look like a reverse stair-stepper if there’s resistance to this pressure. A reverse stair-stepper is simply a stair stepper that’s more bearish than the bullish one mentioned above.
The Shooting Star Candlestick Patterns
The image of a literal shooting star may bring forth connotations of an upwards journey. But that’s not the case for this bearish pattern.
The name has more to do with the fact that it’s at the top of an uptrend. In addition, it can be an indicator of a bearish reversal. It’s easy to confuse a shooting star with an inverted hammer as they look identical.
However, the difference is that a shooting star has to be at the peak of an uptrend, whereas an inverted hammer is in a downtrend. This is why context is integral for deciding to sell or not.
Dojis:
The Hammer Doji Trader Candlestick Patterns
The Hammer Doji, also known as the Dragonfly Doji, is at the bottom of a downtrend. While this may seem like bad news. It can signify that there may be a bullish reversal which means the price will rise again.
As a result, this kind of Doji looks more like a nail than a hammer. However, the name derives from the fact that it looks like a nail going down. This is because of the long wick at the end. The long wick means that the price fell during the period. But made its way back up to the opening price.
The Gravestone Doji Candlestick Patterns
The Gravestone Doji is the opposite of a Hammer Doji, as it has a long wick on the top. This means that the price rose during the period. However, I did not make it to the end of the selected time.
For example, the price rose halfway through an hour chart and fell back to or close. To the opening price to understand basic Candlestick charts.
Although a gravestone, Doji can form anywhere. So, when it comes to the top of an upward trajectory, it can mean that the trend could halt or reverse.
Extra Stock Market Patterns
- Hammer and Hanging Man: These patterns indicate trend reversals, with the Hammer being a bullish reversal signal and the Hanging Man a bearish one.
- Shooting Star: Often found at the end of an uptrend, the Shooting Star pattern is a bearish signal.
- Morning Star and Evening Star: These patterns signal the end of a trend, with the Morning Star indicating the end of a downtrend and the Evening Star the end of an uptrend.
Why Learn About Specific Candlestick Patterns?
- Improved Trading Strategy: By understanding these patterns, you can create more effective trading strategies.
- Risk Management: Specific Candlestick Patterns allow traders to set stop losses and take profits more precisely.
- Enhanced Decision Making: These patterns provide actionable insights that support informed trading decisions.